
A series of blog posts designed to share Horizon 2020 narrativisation experiences. It is time to tell Action Plans.
From December 2018, I worked as EU Project Manager for the Italian municipality of Appignano del Tronto. The municipality is an official partner of the Ruritage project. Ruritage is a four-year-long EU project, funded by Horizon 2020 program, focused on rural regeneration through cultural and natural heritage.
Therefore, I experienced a series of project narrative tools that I would like to share.
The first communication tool I used was infographics (1).
At the beginning of the project activities, we needed to communicate with the local community what Ruritage was. Our communication targets were three main groups: members of the municipality council, stakeholders and the general public. The objective was to give them a quick understanding of the project, avoiding its complexity to ensure people were not deterred.
Infographics could help us.
The first infographic we created was “Ruritage in 5 points”, which visualized five key elements of the Ruritage project (eg. Horizon2020 Programme, Rural Heritage concept, number of partners and countries involved etc.). The second, “Ruritage activities”, summarized the five main activities that would have been implemented at the local level.
We used it to introduce the members of the local municipality council to the Ruritage project. Even if the municipality was an official partner of the project only the mayor was well informed about it. It was necessary, for better engagement, to involve all the other members of the council.
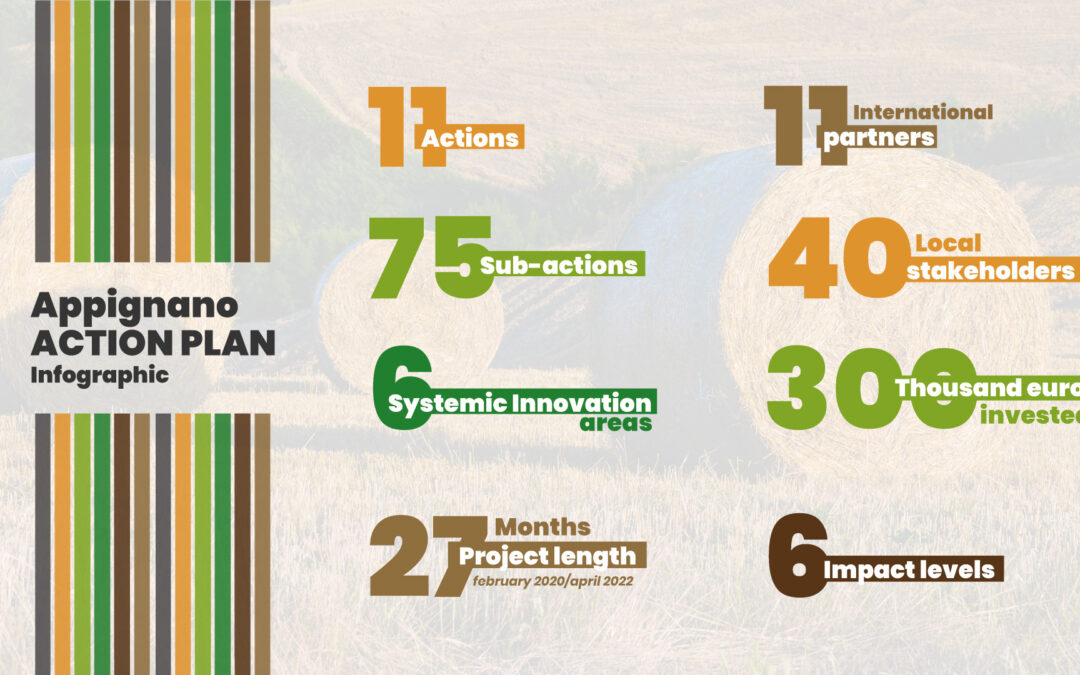
The third infographic we created was “Appignano Action Plan”. In the second part of 2019, the local community of Appignano del Tronto was involved in an intense phase of project co-creation. The project stakeholders attended a serious game, a participatory workshop, a business model canvas and three round tables. The result was a local regeneration plan made by 11 actions supported by 11 international partners.
Consequently, our need was to communicate effectively and quickly the action plan to the local community. Especially highlighting the impact on the everyday life of Appignano del Tronto. In this way, the “Appignano Action Plan” infographic was a very useful tool to visualize the key elements of the plan.
We first used it in the online presentation of the action plan to the local community.
When we started the Ruritage project, our first concern was to avoid the people of a small rural community would be excluded from the project.
English as the main communication language, the use of project management technicalities and, above all, the complexity of the Ruritage project, risked excluding local people instead of engaging them. To illustrate a project with 37 partners from 20 countries, linked by a complex theoretical framework, is complicated.
Infographics were one of the tools we choose to deliver complex information in a simple way making them more confident with project activities.
To better identify Ruritage and its topic we make an infographic using a rural background and the same project colours to assist people with project identification.
In conclusion, of its capacity to summarize complex activities, underline key elements and inform through data, infographics can be an effective tool for Horizon narrativisation.
(1) Here we define infographics are «visual representations of information, data or knowledge intended to clarify and integrate difficult information quickly and clearly» in Waralak V. Siricharoen, Infographic: The New Communication Tools in Digital Age, Conference Paper 2013, p. 169.